Bibliografía
Buenos Aires 01 de Septiembre del 2021
Quality Control and Operator Training at Point at Point of Care Testing
Quality Control and Operator Training at Point-of-Care Testing
A College of American Pathologists Q-Probes Study of 106 Institutions
Kathryn S. Dyhdalo, MD; Peter J. Howanitz, MD; David S. Wilkinson, MD, PhD; Rhona J. Souers, MS; Bruce A. Jones, MD
Context.-Operator training, quality control, and proper follow-up for out-of-range quality control (QC) events are crucial steps that must be adequately performed and documented to ensure excellent patient care and regulatory compliance.
Objective.-To examine point-of-care testing (POCT) personnel training and QC documentation/compliance. Design.-Participants in a POCT documentation study of the College of American Pathologists Q-Probes program collected data retrospectively for glucose and urine dipstick testing regarding test operators, operator competency assessment, and QC documentation. Documentation was assessed for participant adherence to 4 quality indicators: (1) whether test operator training was up to date, (2) whether the test operator names were noted in the test records, (3) whether QC was performed, and (4) whether out-of-range QC events were followed up. Data were analyzed for associations with institutional demographic and practice variables.
Results.-The institutional median number of POCT personnel was 648 for blood glucose and 76 for urine dipstick testing, with a median number of 105 948 glucose tests and 9113 urine tests performed. Ninety-four percent (3830 of 4074) of the test operators completed training or competency assessment within the prior 12 months, 96.8% (21 603 of 22 317) of the test records documented the operator, and 95.7% (19 632 of 20 514) of the expected QC events (per institutional regulations) were documented. Approximately 3% (659 of 20 514) of the QC events were outside the designated range (an average of 6 out-ofrange QC events were identified per institution [n¼ 106]). Of the out-of-range QC events, 92.6% (610 of 659) had documentation of appropriate follow-up. Most laboratories (176 of 179; 98.3%) violated specimen requirements by storing POCT urine specimens for less than 24 hours. Conclusions.-There was greater than 90% compliance for POCT documentation and nearly 96% of expected QC events were properly documented.
(Arch Pathol Lab Med. 2014;138:1444-1448; doi: 10.5858/arpa.2013-0552-CP)
Point-of-care testing (POCT) is defined as testing that occurs at or near the site of patient care, with the goal of providing rapid information and improving patient outcomes.1,2 Point-of-care testing is growing several times faster than is central laboratory testing in the United States2,3 and has become ubiquitous in both hospitals and outpatient care settings. Because POCT is typically performed by nonlaboratory personnel, many health care workers are now performing a wide variety of tests. Quality patient care is dependent on accurate laboratory results, necessitating assurance that POCT is well documented, equipment is well maintained, and testing operators are qualified to perform the tests. It is also important to ensure that quality control (QC) procedures are run consistently and that documentation of QC performance and follow-up of out-of-range QC results are recorded to ensure accurate results and high-quality patient care. Additionally, POCT is subject to regulatory requirements that, if ignored, can lead to loss of accreditation.4 The College of American Pathologists (CAP) POCT accreditation checklist requires that (1) POCT instruments have defined QC ranges, (2) QC results are evaluated daily, (3) corrective action is taken when results exceed defined tolerance limits, and (4) QC results are verified before patient results are reported.5 A complete POCT program includes organization, supervision, written procedures, operator training and competency, instrument evaluation, quality control, proficiency testing, and appropriate recording of result and notification, all with the necessary documentation. However, achieving compliance with regulatory guidelines and ensuring the quality of POCT has proved challenging in many institutions.
In the authors' experience, performance of traditional QC is a misunderstood and undervalued concept for many nonlaboratory personnel because they are largely unfamiliar with laboratory operations, standards, and limitations.
Although proficiency testing provides a periodic audit of testing accuracy, periodic audits of testing documentation can provide valuable information regarding the operational performance of the POCT program. The CAP Q-Probes program administers voluntary quality improvement studies that provide valuable information regarding current practice patterns and opportunities for improvement in anatomic and clinical pathology. We report the results of a Q-Probes study that examined POCT personnel training, proficiency testing, and QC documentation compliance.
MATERIALS AND METHODS
Participants voluntarily enrolled in the CAP Q-Probes program for documentation of POC testing; data collection instructions were distributed in 2008. Participants collected data in 2 parts: (1) a retrospective review of records (test logs, patient charts, or other documentation that showed testing had been performed) for glucose testing and urine reagent strip (dipstick) testing; and (2) a retrospective review of QC documentation for glucose testing and urine dipstick testing. Point-of-care testing from outpatient, inpatient, and emergency department settings was included. Excluded events included POCT performed by physicians and testing performed on POCT instruments in the laboratory. In the first part of the study, participants retrospectively reviewed consecutive testing documentation for glucose and urine reagent strip (dipstick) tests from up to 3 locations until 25 different operators were identified. If fewer than 25 operators were identified after a maximum of 500 consecutive records were reviewed, the participant recorded the number of unique operators identified. From those documents, participants recorded the total number of consecutive records reviewed and the number of records with no documentation about the testing personnel. Participants also determined the total number of unique operators for each test, the number of test operators per testing location (emergency department, outpatient clinic, or inpatient ward), and the total number of operators who had training or competency assessment in the prior 12 months. In each testing location, the number of operators with documented training or competency assessment for each test was also recorded.
The second part of the study involved a retrospective review of QC documentation from glucose and urine dipstick testing from 2 testing sites for 1 month. If only one site was available for each test, 2 months of information was reviewed. If there was only one site but 2 instruments were used for a test, then documentation for both instruments was recorded for 1 month. For each site, participants recorded the total number of QC events that should have occurred (according to institutional policy), the number of times QC was not recorded when it should have been (according to institutional policy), the number of times QC was outside the acceptable range, and, when the QC was outside the acceptable range, the number of times an appropriate response or action was documented (according to institutional policy). Four quality indicators were determined: (1) percentage of test operators with documentation of current training and/or competency assessment, (2) percentage of test records with documentation of test operator name, (3) percentage of documented QC events, and (4) percentage of out-of-range QC events with documentation on the follow-up action taken. The overall quality indicators and the test-specific quality indicators were analyzed for associations with institutional demographics and practice characteristics. Initially, the indicator distributions were tested for normality, and results from all 4 indicators had severely skewed distributions. Those nonnormal distributions required rank-based analyses for the preliminary tests and log transformations for the multivariate regression analyses. Individual associations between the indicators and the demographic and practice variables were investigated using Kruskal-Wallis tests for discrete-valued, independent variables and regression analysis for continuous, independent variables. Variables with significant associations (P , .10) were then introduced into a forward-selection, multivariate, regression model. A P value less than .05 was considered statistically significant. In addition, the Wilcoxon signed rank test was used to analyze the pairwise differences between the glucose testing and urine testing documentation rates. The significance level of P , .05 was also used for this testing. All analyses were performed with SAS 9.1 statistical software (SAS Institute, Cary, North Carolina).
RESULTS
Participants from 106 institutions submitted data for analysis. Most of the 106 institutions (96.2%; n ¼ 102) were located in the United States, with the remaining located in Saudi Arabia (1.9%; n ¼ 2), Bermuda (0.9%; n ¼ 1), and Spain (0.9%; n ¼ 1). Of the participating institutions, 34.2% (26 of 76) were teaching hospitals, and 21.0% (17 of 81) had a pathology residency program. Within the prior 2 years, the CAP inspected 85.2% (69 of 81) of these laboratories. Laboratory inspections were conducted by the Joint Commission at approximately 33.3% (27 of 81) of these institutions within the prior 2 years. Participant demographic information is summarized in Table 1.
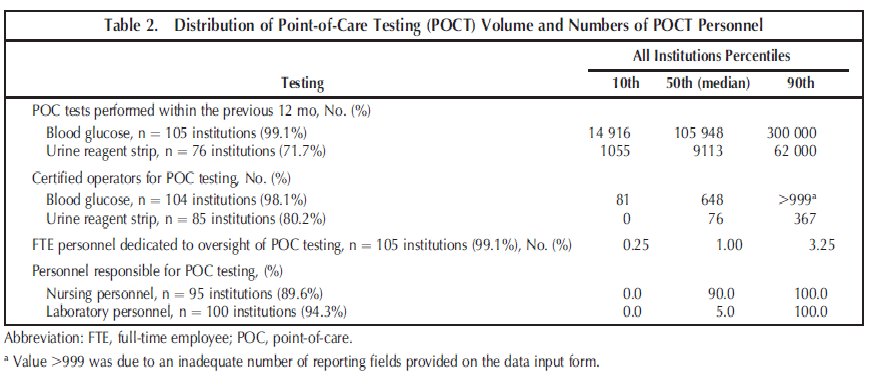
Table 2 summarizes the volumes of point-of-care tests for blood glucose and urine reagent strip, the number of testing personnel, the number of personnel responsible for POCT oversight, and the percentage of personnel types (nursing or laboratory personnel) responsible for testing.
The distributions of the quality indicators for this study are summarized in Table 3. Participants from 106 institutions reviewed 22 317 POC test records from inpatient, outpatient, and emergency department settings. A total of 94.0% (3830 of 4074) of the test operators had completed training or competency assessment within the previous 12 months, and 96.8% (21 603 of 22 317) of the glucose and urine reagent strip test records had documentation of the name of the individual who performed the test. The average number of test records reviewed per institution was 219. For all institutions combined, the overall number of test operators monitored was 4074 with an average of 40 test operators monitored per institution.
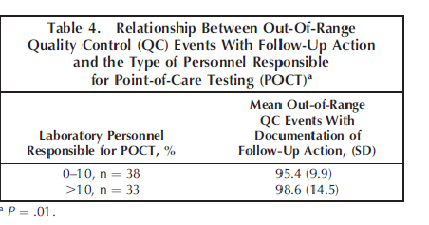
Participants identified a total of 20 514 QC events that should have occurred (per institutional regulations) for glucose and urine reagent strip testing, with an average of 195 QC events per institution. Documentation of those QC events was identified for 95.7% (19 632 of 20 514) of those expected QC events. Of the 20 514 events, approximately 3% (n ¼ 659) were outside the designated range, with an average of 6 out-of-range QC events identified per institution. Of the out-of-range QC results, 92.6% (610 of 659, with 75 institutions reporting) had documentation of appropriate follow-up action per institutional policy. A statistically significant association (P ¼ .01) was found between higher percentages of out-of-range QC events that had documentation of follow-up action and institutions with a higher percentage of laboratory personnel responsible for POC testing, as summarized in Table 4.
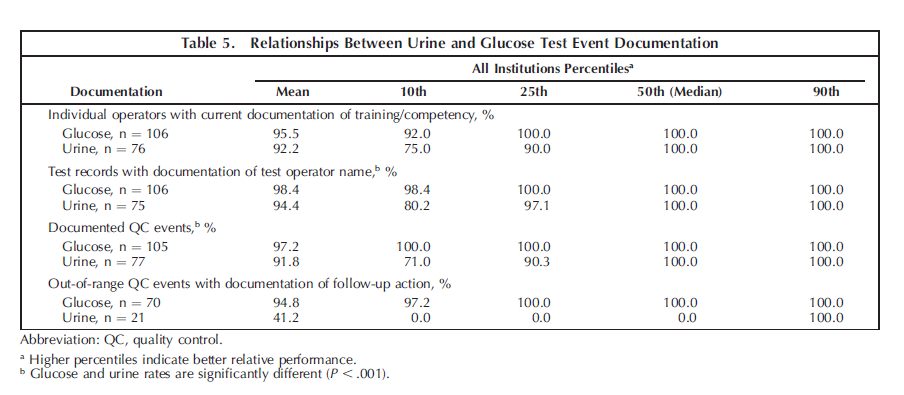
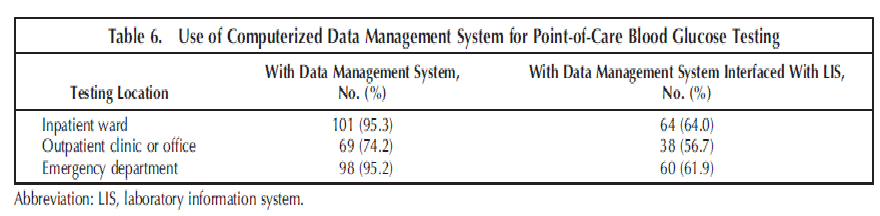
Data were analyzed to determine whether the documentation rates differed significantly between the urine tests and the glucose tests (Table 5). There was significantly lower compliance in documentation of the test operator and documentation of QC events for point-of-care urinalysis (P , .001) as compared with glucose testing. The widespread use of computerized data-management systems for pointof-care glucose testing may account for those differences (Table 6). Institutions with CAP inspections (n ¼ 42; 40%)
during the prior 2 years had significantly higher test
operator documentation rates for urine testing (Kruskal-
Wallis; P ¼ .01). The 42 CAP-inspected institutions had documentation rates ranging from 50% to 100%; the 10 institutions without a recent CAP inspection had documentation rates ranging from 28% to 100%.
COMMENTS
The institution performance patterns are similar. Approximately one quarter of participants (19 of 75) were less than 90% compliant for documentation of follow-up for out-ofrange QC events and 9% of these laboratories (7 of 75) had less than 50% compliance. Approximately 10% of laboratories (14 of 106) were less than 90% compliant for documentation of test operator and documentation of QC events (11 of 105 institutions) (Table 3).
The median participating institution performed almost 12 times the number of POCT glucose tests (n ¼ 105 948) as urine reagent strip tests (n ¼ 9113), with almost 9 times the number of individuals performing the tests (glucose, 648; urine, 76). Most participating institutions (75 of 105; 71.4%) had one or more full-time equivalent employees dedicated to the oversight of POCT. Most of the individuals performing POCT were nursing department personnel (Table 2). Although overall compliance for follow-up action taken for out-of-range QC events was good (92.6% [610 of 659] of all such events), institutions reporting that more than 10% of individuals performing POCT were laboratory personnel exhibited a small, but statistically significant advantage in compliance (mean of 98.6% versus 95.4%) (Table 4).
Although overall compliance in documentation of followup for out-of-range QC events was greater than 90%, it is concerning that 10% of laboratories reported less than 50% compliance (Table 3).
The underlying etiologies are likely institution specific, and any proposed solutions would depend on root cause analysis and are perhaps best left to each individual institution. Investigations should address the adequacy of POCT oversight; provide education regarding the importance of QC for both regulatory compliance and patient care; establish institutional policy and training of both POCT personnel and supervisors; ensure competency in POCT instrumentation, software, and design regarding QC; and monitor QC performance and compliance, as well as any other variables that may affect the POCT program at an institution. Some authors2,6 have suggested solutions such as increased oversight by a dedicated POCT supervisor, improved or reeducation of POCT personnel, and enhanced QC design features, such as instrument locks in the event of a QC failure.
Some differences were noted between documentation for blood glucose testing and urinalysis. In particular, point-ofcare urinalysis testing has significantly lower compliance in the rate of documentation of the test operator and the percentage of documented QC events. It is likely that data management system technology for POCT blood glucose testing, interfaced with the laboratory information system, facilitates compliance for those aspects of documentation. Most respondents use a computerized data management system for their point-of-care blood glucose testing, and most of these are interfaced with a laboratory information system (Table 6).
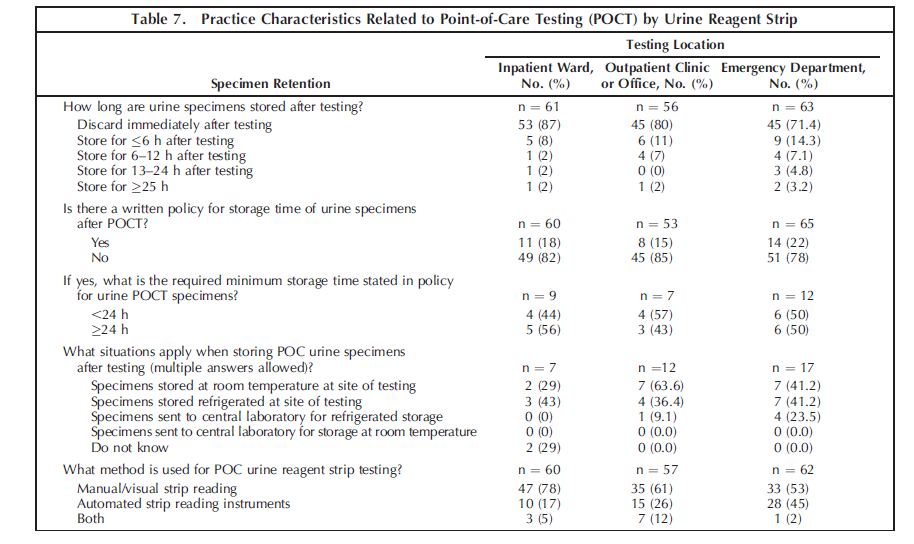
Nearly 96% (19 632 of 20 514) of expected QC events (per institutional guidelines) were properly documented. This is an improvement from previous Q-Probes studies,7,8 which showed a 90% documentation rate. The increased focus on POCT by various regulatory agencies likely has a role in those improved compliance rates.9 Close attention and adherence to POCT glucose QC procedures is important because a positive relationship exists between the performance of QC testing and the accuracy of point-of-care glucose values.8 Although accurate POCT glucose values are important for patient care, patient outcomes related to the quality of POCT results are difficult to quantitate.10 According to the Centers for Medicare and Medicaid Services, competency assessment of POCT personnel requires 6 procedures, which include monitoring the recording and reporting of test results (1 of 6) and review of the test results and QC records (2 of 6).11 The CAP Laboratory Accreditation Program general checklist12 requires that urine specimens be retained for 24 hours, without specifying the location of testing. However, the current practice for most participating institutions (143 of 179; 79.9%) is to discard point-of-care urine specimens immediately after initial testing (Table 7). This is likely due to the lack of a written policy addressing that issue in most institutions (written policy in 33 of 178 [18.5%] respondents; (Table 7). Most laboratories appear to apply a different standard of care for their point-of-care urine testing versus urine testing performed in the central laboratory. Each institution should reassess its current practice, standardize its practice, and develop a uniform written policy that is compliant with current regulatory guidelines.
The continuing growth of POCT, coupled with its presence in a variety of clinical settings, ensures that it will continue to be both an area of regulatory focus and a focal point in the struggle to comply with strict regulatory guidelines. The involvement of a variety of nonlaboratory personnel introduces both an additional challenge and an opportunity for education about good laboratory testing practices. Although many institutions are appropriately documenting POCT-associated events most of the time, improvements should still be actively pursued to continue to ensure both patient safety and high-quality patient care.
References
1. Howanitz PJ, Jones BA; College of American Pathologists. Comparative analytical costs of central laboratory glucose and bedside glucose testing: a College of American Pathologists Q-probes study. Arch Pathol Lab Med. 2004;128(7):739-745.
2. Kost GJ. Preventing medical errors in point-of-care testing: security, validation, safeguards, and connectivity. Arch Pathol Lab Med. 2001;125(10):1307-1315.
3. Bowman C, Hamill T. Assuring quality in point-of-care testing. Arch Pathol Lab Med. 2012;136(5):472-473.
4. Centers for Medicare & Medicaid Services, Department of Health and Human Services. Clinical laboratory improvement amendments of 1988; final rule. Fed Regist. 1992;57(40):7139-7186. Codified at 42 CFR §49342 CFR Part 493. h t t p : / /www.gpo.gov/fdsys/pkg/CFR-2003- t itle42-vol3/xml/ CFR-2003-title42-vol3-part493.xml. Accessed July 25, 2013.
5. College of American Pathologists. Point-of-Care-Testing Checklist. Northfield, IL: College of American Pathologists; 2013.
6. Lewandrowski K, Gregory K, Macmillan D. Assuring quality in point-ofcare testing: evolution of technologies, informatics, and program management. Arch Pathol Lab Med. 2011;135(11):1405-1414.
7. Jones BA, Howanitz PJ. Bedside glucose monitoring quality control practices: a College of American Pathologists Q-Probes study of program quality control documentation, program characteristics, and accuracy performance in 544 institutions. Arch Pathol Lab Med. 1996;120(4):339-345.
8. Novis DA, Jones BA. Interinstitutional comparison of bedside blood glucose monitoring program characteristics, accuracy performance, and quality control documentation: a College of American Pathologists Q-probes study of bedside blood glucose monitoring performed in 226 small hospitals. Arch Pathol Lab Med. 1998;122(6):495-502.
9. Belanger AC. Alternate site testing: the regulatory perspective. Arch Pathol Lab Med. 1995;119(10):902-906.
10. Howanitz PJ, Jones BA. Bedside glucose monitoring: comparison of performance as studied by the College of American Pathologists Q-Probes program. Arch Pathol Lab Med. 1996;120:333-338.
11. Centers for Medicare & Medicaid Services. What do I need to do to assess personnel competency? http://www.cms.gov/Regulations-and-Guidance/ Legislation/CLIA/Downloads/CLIA_CompBrochure_508.pdf. Published November 2012. Accessed August 21, 2013.
12. College of American Pathologists. GEN.20377: record/specimen retention. In: Laboratory General Checklist. Northfield, IL: College of American Pathologists; 2013; v072913